In this article, we will enhance the Gantt Chart component with some interaction possibilities for editing the jobs. In doing so, we will continue to work with Vanilla JS and Web Components and look at some JavaScript libraries that can greatly simplify the effort of developing a fully functional Gantt Chart.
This article has been kindly supported by our dear friends at Bryntum who are strong believers in the web as an application platform and provide advanced UI components and dev tools for over 5000 companies in 70+ countries. Thank you!
In Part 1 of this article, we developed a web component for an interactive Gantt Chart. Now we will enhance the Gantt Chart component with some interaction possibilities for editing the jobs: the job bars are made resizable by mouse-dragging, and we also implement an editing dialogue that can be used to modify the start and end dates of a job. In doing so, we will continue to work with Vanilla JS and Web Components. In the end, we will look at some JavaScript libraries that can greatly simplify the effort of developing a fully functional Gantt Chart.
The following video shows what we are going to build in this article. First, we will add a drag handle on the right-hand side of each job that can be used for resizing the job bar (in the picture, it’s shown as a narrow gray vertical bar). In the next step, we will further extend the behavior of the jobs so that double-clicking on a job bar opens an editing dialogue.
To follow the instructions in this article, you can use the files from the previous article as a starting point. The source code of the finished solution can be found in my GitHub repository.
Since the code contains JavaScript modules, you can only run the example from an HTTP server and not from the local file system. For testing on your local PC, I’d recommend the module live-server, which you can install via npm.
Alternatively, you can try out the example here directly in your browser without installation.
A Web Component For Jobs #
Before we extend the functionality of jobs, we move the source code related to jobs into a separate component with the name GanttJob.
The component contains setters and getters for a job object and for the selected zoom level of the Gantt Chart’s time axis (year-month or day). It renders a job as a simple div element <div class="job"></div>. The length of the job bar is calculated in the render function depending on the zoom level and the duration of the job.
Compared to Part 1 of this article, I have changed the styling of the jobs a bit.
Note: Check some minor changes in the CSS style of the component VanillaGanttChart.
In the class YearMonthRenderer, you only need to adapt the function initJobs for now. Instead of a simple div element, the custom element gantt-job is inserted into the Gantt grid for each job from the jobs array. It is initialized with the properties id, job, and level. Furthermore, there are no changes to the drag-and-drop implementation of the jobs within the Gantt grid.
The same changes are applied to the class DateTimeRenderer.
Making Jobs Resizable #
The
user should be able to increase or decrease the duration of a job by
dragging the right outer edge of a job bar. Furthermore, changing the
duration should be possible only in steps corresponding to the size of
the time segments in the currently active view. This means that if the
level year-month is set, the duration can only be changed in steps of full days, and if the level day is set, the duration can only be changed in steps of full hours.
First, a drag handle is added to the right side of a job bar using CSS (see file styles/GanttJob.css).
To make a job resizable, the following strategy can be used:
- Resizing starts when the user clicks on the drag handle of a job. It means we have to respond to the
mousedownevent in the Gantt chart. - From
this point on, the job bar increases or decreases as the user moves the
mouse to the left or right. This behavior can be controlled via the
mousemoveevent. - The resizing is finished as soon as the user releases the mouse button again: once the
mouseupevent occurs.
It might be your first thought to add a mousedown listener to the job bar within the GanttJob
component. However, depending on the number of jobs in the Gantt Chart,
this could result in a huge number of listeners, which could affect the
component’s performance.
Therefore, in this case, I use the concept of event delegation. Instead of installing a separate mousedown listener for each job, we install exactly one listener for the common parent element. In our case, this is the div element with the ID gantt-container, which contains the complete Gantt Chart.
You can add the following code to the file YearMonthRenderer.js:
The mousedown handler checks whether the user has clicked on a GanttJob element. If this is the case, it must still be checked whether the user has clicked on the drag handle. Only then the mousemove and mouseup listeners are installed for the duration of the resize operation.
In the file GanttJob.js, the function isMouseOverDragHandle is added:
The remaining handler functions are now added to the file YearMonthRenderer.js.
In the handler _handleMouseMove, we first need to check which section of the Gantt Chart the mouse cursor is currently over. The corresponding gantt-item tells us the new end date of the job through the attribute data-date. By calling the update function of the selected GanttJob element, we update the length of the job bar.
As you can see in the render function of the GanttJob component, the length is modified only in steps corresponding to the size of the time sections of the Gantt Chart.
In the handler _handleMouseUp, the selection of the job is cleared, and the mousemove listener is removed.
In the last step, we call the function makeJobsResizable at the end of the function initJobs. We also use the existing function clear in the file YearMonthRenderer.js to remove the mousedown and mouseup listeners (see sample files).
All the steps shown above are also applied to the file DateTimeRenderer.js.
Making Jobs Editable #
A
job’s start and end dates should also be modifiable via an edit dialog.
For this purpose, we first develop our own web component for the dialog
with the name GanttJobDialog.
The following properties are assigned to the dialog from outside:
jobfor the job object to be edited;levelfor the current zoom level of the timeline (year-monthorday);xPosandyPosfor thexandycoordinates of the position of the upper left corner of the dialog, relative to the position of the associated job bar.
In the render
function, the appropriate form elements for adjusting the start and end
dates are generated depending on the zoom level. Inputs of type date are used when the level is set to year-month, and inputs of type datetime-local are used when the level is day. Furthermore, the values of the inputs are initialized with the current data of the job.
The handler for the save button of the dialog has the following responsibilities:
- the new start and end dates are read from the input fields and assigned to the job object;
- a
CustomEventwith the event namesaveis triggered to notify the caller of the dialog (here theGanttJobcomponent) that the job data has been changed; - the dialog is made invisible.
The handler for the dialog’s cancel button fires a CustomEvent with the event name cancel to notify the dialog’s caller that no data has been changed.
The edit dialog is to be opened by double-clicking on a job bar. Therefore, we need a listener for the dblclick event, which we again attach to the surrounding gantt-container according to the principle of event delegation (the listener is removed in the function clear; see example files).
For this purpose, we add the function makeJobsEditable in the file YearMonthRenderer.js:
The actual processing of the event takes place in the GanttJob component. Here, an instance of the GanttJobDialog component is initialized and inserted into the DOM as a child element of the job bar.
At this point, we also implement the handlers for the CustomEvents save and cancel triggered by the dialog. Both handlers remove the dialog from the DOM. The save handler additionally triggers an update of the length of the job bar and, in turn, forwards a CustomEvent editjob to the associated renderer (YearMonthRenderer or DateTimeRenderer).
Back in the file YearMonthRenderer.js, we have to extend the function initJobs once again. First, a handler for the event editjob
is defined to ensure that the job is re-inserted at the correct
position in the Gantt Chart in case of a changed start time. Secondly, a
call to makeJobsEditable is placed at the end of the function.
All the steps shown are also applied to the file DateTimeRenderer.js.
Special Libraries For Gantt Charts And Scheduling #
With
the code enhancements presented in this second part of the article, the
Gantt Chart has become a little more interactive and user-friendly.
Nevertheless, there are still a few things left open. For example, when
dropping a job, the left side of the job bar (which means the start
time) jumps to the gantt cell that was just below the mouse pointer. Instead, the job should be positioned exactly in the cell to which the left side of the bar points regardless of the position of the mouse pointer on the job bar.
Above that, we need a few more refinements that make the interaction with the Gantt Chart even smoother, such as a flexible adjustment of the chart to the screen size or a flexible positioning of the editing dialogs depending on the available space.
The present chart component can be configured both as a Gantt Chart and a resource scheduler. If used as a Gantt Chart, some rules still have to be implemented. For example, in this case, a job may not be moved from one row to the next. In addition, more Gantt Chart specific configuration options are needed, such as sequence dependencies between jobs or a hierarchical organization of tasks into subtasks.
Users will likely expect even more features in a professional Gantt Chart for production use:
- reordering of rows in the WBS tree of tasks and subtasks;
- filtering, sorting, inline cell editing;
- tracking data changes;
- Zooming into different views with different time granularity (days vs months vs years);
- dependencies between tasks;
- non-working time;
- tooltips
- .. and more.
So, if you want further to develop your own Gantt Chart or scheduling component, those are some feature ideas to consider.
However, if you are looking for a Gantt chart solution that you can easily integrate into your web app, it might be worth taking a look at existing third-party JavaScript Gantt libraries. Such libraries contain pre-built, sophisticated components that will save you the massive effort of developing and maintaining your own Gantt widget.
Let’s take a look at three examples of professional Gantt chart libraries.
JavaScript Gantt Chart By Syncfusion #
The handling of Gantt Chart libraries is usually very comfortable. Often a single JavaScript file is sufficient to configure the chart according to your preferences and fill it with data.
For example, let’s look at the index.js
file of our project in this article where we initialize our Gantt Chart
with the required data of our jobs and resources. Our component VanillaGanttChart
is simply imported at the beginning of the file. This is how it works
with ready-made libraries: after importing the required scripts and
modules, you can immediately start entering your data into the Gantt
Chart or configuring the Gantt Chart according to your wishes.
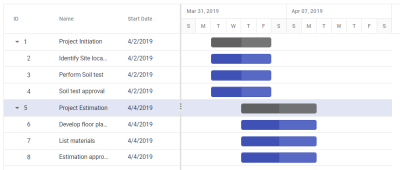
Let’s check out the JavaScript Gantt Chart by Syncfusion. This is a commercial tool “to display and manage hierarchical tasks with timeline details.”
In the “getting started” section of the tool’s documentation, you will learn how to initialize a simple Gantt Chart with a few basic options (e.g., options for task editing, filtering, sorting, and defining task relationships). A first simple Gantt Chart could look like this with Syncfusion:

Building on this, the functionality of the chart can be extended further.
JavaScript Gantt Chart By Bryntum #
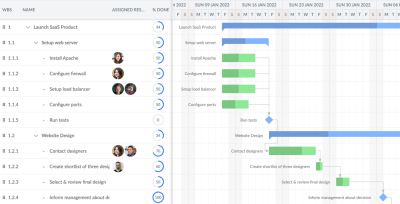
Another example that is worth considering is the Bryntum Gantt library, “a super-fast and fully customizable Gantt chart suite.”
After downloading a free trial of the library, you will get a build folder with CSS and JavaScript files for creating interactive Gantt charts. You can integrate these files into your web app and then immediately configure your individual chart. A simple getting started guide provides a quick introduction to the component. For example, a basic chart could look like this with the Bryntum Gantt library:

You will learn a lot about the numerous customization options in the full Bryntum Gantt documentation. You will also explore how the tool can be integrated with popular frameworks like Angular, React, Vue, and many more or how to organize the loading and saving of data (CRUD data management).
The examples section provides a visual overview of the various features of Bryntum Gantt.

They also offer Bryntum Scheduler — a library for resource planning.
JavaScript Gantt Chart By Webix #
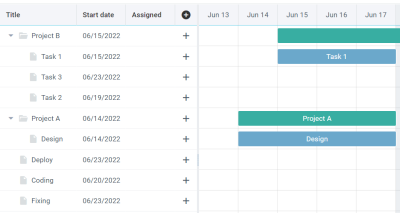
With Webix Gantt, another commercial Gantt library with rich functionality is available. The uncomplicated steps for installing, creating, and configuring a Gantt chart are documented in detail.
You can try out the tool in a full-screen interactive demo:

Conclusion #
Gantt Charts are a valuable visualization for project management, planning, and task organization. There are many ways to integrate Gantt Charts into a web application. In the last two articles, we built an interactive Gantt Chart from scratch, and in doing so, we learned a lot about CSS grids, Web Components, and JavaScript events. If you have more complex requirements, it is worth looking at the commercial JS libraries, which are often very powerful.
No comments:
Post a Comment