I work for Bookaway, a digital travel brand. As an online booking platform, we connect travelers with transport providers worldwide, offering bus, ferry, train, and car transfers in over 30 countries. We aim to eliminate the complexity and hassle associated with travel planning by providing a one-stop solution for all transportation needs.
A cornerstone of our business model lies in the development of effective landing pages. These pages serve as a pivotal tool in our digital marketing strategy, not only providing valuable information about our services but also designed to be easily discoverable through search engines. Although landing pages are a common practice in online marketing, we were trying to make the most of it.
SEO is key to our success. It increases our visibility and enables us to draw a steady stream of organic (or “free”) traffic to our site. While paid marketing strategies like Google Ads play a part in our approach as well, enhancing our organic traffic remains a major priority. The higher our organic traffic, the more profitable we become as a company.xperience:
- Largest Contentful Paint (LCP)
Measures the time it takes for the main content on a webpage to load. - First Input Delay (FID)
Assesses the time it takes for a page to become interactive.
Note: Google plans to replace this metric with another one called Interaction to Next Paint (INP) beginning in 2024. - Cumulative Layout Shift (CLS)
Calculates the visual stability of a page.

While optimizing for FID and CLS was relatively straightforward, LCP posed a greater challenge due to the multiple factors involved. LCP is particularly vital for landing pages, which are predominantly content and often the first touch-point a visitor has with a website. A low LCP ensures that visitors can view the main content of your page sooner, which is critical for maintaining user engagement and reducing bounce rates.
Largest Contentful Paint (LCP) #
LCP measures the perceived load speed of a webpage from a user’s perspective. It pinpoints the moment during a page’s loading phase when the primary — or “largest” — content has been fully rendered on the screen. This could be an image, a block of text, or even an embedded video. LCP is an essential metric because it gives a real-world indication of the user experience, especially for content-heavy sites.
However, achieving a good LCP score is often a multi-faceted process that involves optimizing several stages of loading and rendering. Each stage has its unique challenges and potential pitfalls, as other case studies show.
Here’s a breakdown of the moving pieces.
Time To First Byte (TTFB) #
This is the time it takes for the first piece of information from the server to reach the user’s browser. You need to beware that slow server response times can significantly increase TTFB, often due to server overload, network issues, or un-optimized logic on the server side.
Download Time of HTML #
This is the time it takes to download the page’s HTML file. You need to beware of large HTML files or slow network connections because they can lead to longer download times.
HTML Processing #
Once
a web page’s HTML file has been downloaded, the browser begins to
process the contents line by line, translating code into the visual
website that users interact with. If, during this process, the browser
encounters a <script> or <style> tag that lacks either an async or deferred attribute, the rendering of the webpage comes to a halt.
The
browser must then pause to fetch and parse the corresponding files.
These files can be complex and potentially take a significant amount of
time to download and interpret, leading to a noticeable delay in the
loading and rendering of the webpage. This is why the async and deferred attributes are crucial, as they ensure an efficient, seamless web browsing experience.
Fetching And Decoding Images #
This is the time taken to fetch, download, and decode images, particularly the largest contentful image. You need to look out for large image file sizes or improperly optimized images that can delay the fetching and decoding process.
First Contentful Paint (FCP) #
This is the time it takes for the browser to render the first bit of content from the DOM. You need to beware of slow server response times, particularly render-blocking JavaScript or CSS, or slow network connections, all of which can negatively affect FCP.
Rendering the Largest Contentful Element #
This is the time taken until the largest contentful element (like a hero image or heading text) is fully rendered on the page. You need to watch out for complex design elements, large media files, or slow browser rendering can delay the time it takes for the largest contentful element to render.
Understanding and optimizing each of these stages can significantly improve a website’s LCP, thereby enhancing the user experience and SEO rankings.
I know that is a lot of information to unpack in a single sitting, and it definitely took our team time to wrap our minds around what it takes to achieve a low LCP score. But once we had a good understanding, we knew exactly what to look for and began analyzing the analytics of our user data to identify areas that could be improved.
Analyzing User Data #
To effectively monitor and respond to our website’s performance, we need a robust process for collecting and analyzing this data.
Here’s how we do it at Bookaway.
Next.js For Performance Monitoring #
Many of you reading this may already be familiar with Next.js, but it is a popular open-source JavaScript framework that allows us to monitor our website’s performance in real-time.
One of the key Next.js features we leverage is the reportWebVitals
function, a hook that allows us to capture the Web Vitals metrics for
each page load. We can then forward this data to a custom analytics
service. Most importantly, the function provides us with in-depth
insights into our user experiences in real-time, helping us identify any
performance issues as soon as they arise.

reportWebVitals function. (Large preview)Storing Data In BigQuery For Comprehensive Analysis #
Once we capture the Web Vitals metrics, we store this data in BigQuery, Google Cloud’s fully-managed, serverless data warehouse. Alongside the Web Vitals data, we also record a variety of other important details, such as the date of the page load, the route, whether the user was on a mobile or desktop device, and the language settings. This comprehensive dataset allows us to examine our website’s performance from multiple angles and gain deeper insights into the user experience.
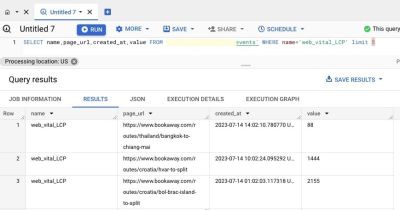
The screenshot features an SQL query from a data table, focusing on the LCP web vital. It shows the retrieval of LCP values (in milliseconds) for specific visits across three unique page URLs that, in turn, represent three different landing pages we serve:
- Bangkok to Chiang Mai in Thailand,
- Hvar to Split in Croatia,
- Bol, Brac Island to Split in Croatia.
These values indicate how quickly major content items on these pages become fully visible to users.
Visualizing Data with Looker Studio #
We visualize performance data using Google’s Looker Studio (formerly called Data Studio). By transforming our raw data into interactive dashboards and reports, we can easily identify trends, pinpoint issues, and monitor improvements over time. These visualizations empower us to make data-driven decisions that enhance our website’s performance and, ultimately, improve our users’ experience.
Looker Studio offers a few key advantages:
- Easy-to-use interface
Looker Studio is intuitive and user-friendly, making it easy for anyone on our team to create and customize reports. - Real-time data
Looker Studio can connect directly to BigQuery, enabling us to create reports using real-time data. - Flexible and customizable
Looker Studio enables us to create customized reports and dashboards that perfectly suit our needs.
Here are some examples:
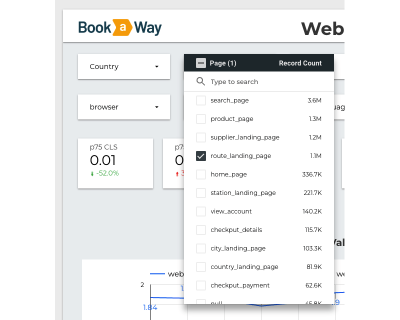
This screenshot shows a crucial functionality we’ve designed within Looker Studio: the capability to filter data by specific groups of pages. This custom feature proves to be invaluable in our context, where we need granular insights about different sections of our website. As the image shows, we’re honing in on our “Route Landing Page” group. This subset of pages has experienced over one million visits in the last week alone, highlighting the significant traffic these pages attract. This demonstration exemplifies how our customizations in Looker Studio help us dissect and understand our site’s performance at a granular level.
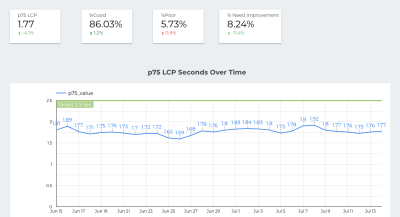
The graph presents the LCP values for the 75th percentile of our users visiting the Route Landing Page group. This percentile represents the user experience of the “average” user, excluding outliers who may have exceptionally good or poor conditions.
A key advantage of using Looker Studio is its ability to segment data based on different variables. In the following screenshot, you can see that we have differentiated between mobile and desktop traffic.
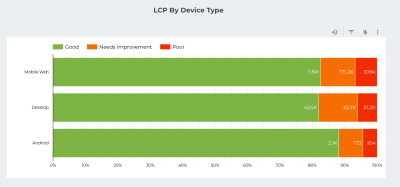
Understanding The Challenges #
In our journey, the key performance data we gathered acted as a compass, pointing us toward specific challenges that lay ahead. Influenced by factors such as global audience diversity, seasonality, and the intricate balance between static and dynamic content, these challenges surfaced as crucial areas of focus. It is within these complexities that we found our opportunity to refine and optimize web performance on a global scale.
Seasonality And A Worldwide Audience #
As an international platform, Bookaway serves a diverse audience from various geographic locations. One of the key challenges that come with serving a worldwide audience is the variation in network conditions and device capabilities across different regions.
Adding to this complexity is the effect of seasonality. Much like physical tourism businesses, our digital platform also experiences seasonal trends. For instance, during winter months, our traffic increases from countries in warmer climates, such as Thailand and Vietnam, where it’s peak travel season. Conversely, in the summer, we see more traffic from European countries where it’s the high season for tourism.
The variation in our performance metrics, correlated with geographic shifts in our user base, points to a clear area of opportunity. We realized that we needed to consider a more global and scalable solution to better serve our global audience.
This understanding prompted us to revisit our approach to content delivery, which we’ll get to in a moment.
Layout Shifts From Dynamic And Static Content #
We have been using dynamic content serving, where each request reaches our back-end server and triggers processes like database retrievals and page renderings. This server interaction is reflected in the TTFB metric, which measures the duration from the client making an HTTP request to the first byte being received by the client’s browser. The shorter the TTFB, the better the perceived speed of the site from the user’s perspective.
While dynamic serving provides simplicity in implementation, it imposes significant time costs due to the computational resources required to generate the pages and the latency involved in serving these pages to users at distant locations.
We recognize the potential benefits of serving static content, which involves delivering pre-generated HTML files like you would see in a Jamstack architecture. This could significantly improve the speed of our content delivery as it eliminates the need for on-the-fly page generation, thereby reducing TTFB. It also opens up the possibility for more effective use of caching strategies, potentially enhancing load times further.
“
In the following sections, we’ll explore the potential challenges and solutions we could encounter as we consider this shift. We’ll also discuss our thoughts on implementing a Content Delivery Network (CDN), which could allow us to fully leverage the advantages of static content serving.
Leveraging A CDN For Content Delivery #
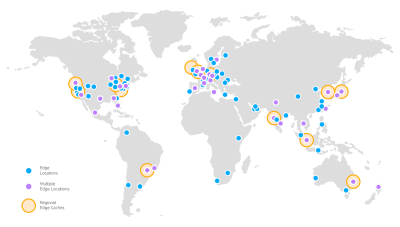
I imagine many of you already understand what a CDN is, but it is essentially a network of servers, often referred to as “edges.” These edge servers are distributed in data centers across the globe. Their primary role is to store (or “cache”) copies of web content — like HTML pages, JavaScript files, and multimedia content — and deliver it to users based on their geographic location.
When a user makes a request to access a website, the DNS routes the request to the edge server that’s geographically closest to the user. This proximity significantly reduces the time it takes for the data to travel from the server to the user, thus reducing latency and improving load times.
A key benefit of this mechanism is that it effectively transforms dynamic content delivery into static content delivery. When the CDN caches a pre-rendered HTML page, no additional server-side computations are required to serve that page to the user. This not only reduces load times but also reduces the load on our origin servers, enhancing our capacity to serve high volumes of traffic.
If the requested content is cached on the edge server and the cache is still fresh, the CDN can immediately deliver it to the user. If the cache has expired or the content isn’t cached, the CDN will retrieve the content from the origin server, deliver it to the user, and update its cache for future requests.
This caching mechanism also improves the website’s resilience to distributed denial-of-service (DDoS) attacks. By serving content from edge servers and reducing the load on the origin server, the CDN provides an additional layer of security. This protection helps ensure the website remains accessible even under high-traffic conditions.
CDN Implementation #
Recognizing the potential benefits of a CDN, we decided to implement one for our landing pages. As our entire infrastructure is already hosted by Amazon Web Services (AWS), choosing Amazon AWS CloudFront as our CDN solution was an immediate and obvious choice. Its robust infrastructure, scalability, and a wide network of edge locations around the world made it a strong candidate.
During the implementation process, we configured a key setting known as max-age. This determines how long a page remains “fresh.” We set this property to three days, and for those three days, any visitor who requests a page is quickly served with the cached version from the nearest edge location. After the three-day period, the page would no longer be considered “fresh.” The next visitor requesting that page wouldn’t receive the cached version from the edge location but would have to wait for the CDN to reach our origin servers and generate a fresh page.
This approach offered an exciting opportunity for us to enhance our web performance. However, transitioning to a CDN system also posed new challenges, particularly with the multitude of pages that were rarely visited. The following sections will discuss how we navigated these hurdles.
Addressing Many Pages With Rare Visits #
Adopting the AWS CloudFront CDN significantly improved our website’s performance. However, it also introduced a unique problem: our “long tail” of rarely visited pages. With over 100,000 landing pages, each available in seven different languages, we managed a total of around 700,000 individual pages.
Many of these pages were rarely visited. Individually, each accounted for a small percentage of our total traffic. Collectively, however, they made up a substantial portion of our web content.
The infrequency of visits meant that our CDN’s max-age setting of three days would often expire without a page being accessed in that timeframe. This resulted in these pages falling out of the CDN’s cache. Consequently, the next visitor requesting that page would not receive the cached version. Instead, they would have to wait for the CDN to reach our origin server and fetch a fresh page.
To address this, we adopted a strategy known as stale-while-revalidate. This approach allows the CDN to serve a stale (or expired) page to the visitor, while simultaneously validating the freshness of the page with the origin server. If the server’s page is newer, it is updated in the cache.
This strategy had an immediate impact. We observed a marked and continuous enhancement in the performance of our long-tail pages. It allowed us to ensure a consistently speedy experience across our extensive range of landing pages, regardless of their frequency of visits. This was a significant achievement in maintaining our website’s performance while serving a global audience.
I am sure you are interested in the results. We will examine them in the next section.
Performance Optimization Results #
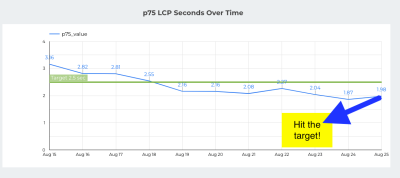
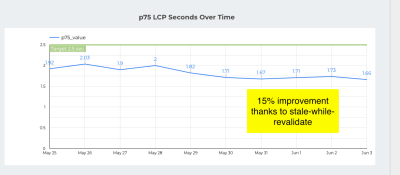
Our primary objective in these optimization efforts was to reduce the LCP metric, a crucial aspect of our landing pages. The implementation of our CDN solution had an immediate positive impact, reducing LCP from 3.5 seconds to 2 seconds. Further applying the stale-while-revalidate strategy resulted in an additional decrease in LCP, bringing it down to 1.7 seconds.
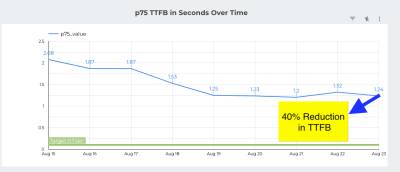
A key component in the sequence of events leading to LCP is the TTFB, which measures the time from the user’s request to the receipt of the first byte of data by the user’s browser. The introduction of our CDN solution prompted a dramatic decrease in TTFB, from 2 seconds to 1.24 seconds.
Stale-While-Revalidate Improvement #
This substantial reduction in TTFB was primarily achieved by transitioning to static content delivery, eliminating the need for back-end server processing for each request, and by capitalizing on CloudFront’s global network of edge locations to minimize network latency. This allowed users to fetch assets from a geographically closer source, substantially reducing processing time.
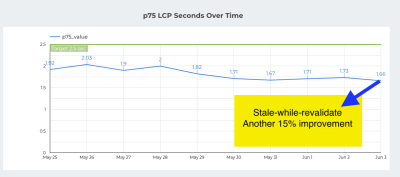
Therefore, it’s crucial to highlight that
“
The overall LCP improvement — thanks to stale-while-revalidate — was around 15% for the 75th percentile.
User Experience Results #
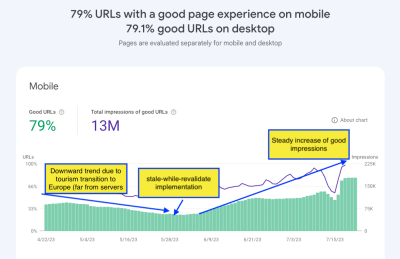
The “Page Experience” section in Google Search Console evaluates your website’s user experience through metrics like load times, interactivity, and content stability. It also reports on mobile usability, security, and best practices such as HTTPS. The screenshot below illustrates the substantial improvement in our site’s performance due to our implementation of the stale-while-revalidate strategy.
Conclusion #
I hope that documenting the work we did at Bookaway gives you a good idea of the effort that it takes to tackle improvements for Core Web Vitals. Even though there is plenty of documentation and tutorials about them, I know it helps to know what it looks like in a real-life project.
And since everything I have covered in this article is based on a real-life project, it’s entirely possible that the insights we discovered at Bookaway will differ from yours. Where LCP was the primary focus for us, you may very well find that another Web Vital metric is more pertinent to your scenario.
That said, here are the key lessons I took away from my experience:
- Optimize Website Loading and Rendering.
Pay close attention to the stages of your website’s loading and rendering process. Each stage — from TTFB, download time of HTML, and FCP, to fetching and decoding of images, parsing of JavaScript and CSS, and rendering of the largest contentful element — needs to be optimized. Understand potential pitfalls at each stage and make necessary adjustments to improve your site’s overall user experience. - Implement Performance Monitoring Tools.
Utilize tools such as Next.js for real-time performance monitoring and BigQuery for storing and analyzing data. Visualizing your performance data with tools like Looker Studio can help provide valuable insights into your website’s performance, enabling you to make informed, data-driven decisions. - Consider Static Content Delivery and CDN.
Transitioning from dynamic to static content delivery can greatly reduce the TTFB and improve site loading speed. Implementing a CDN can further optimize performance by serving pre-rendered HTML pages from edge servers close to the user’s location, reducing latency and improving load times.
No comments:
Post a Comment