⭐ If you would like to buy me a coffee, well thank you very much that is mega kind! : https://www.buymeacoffee.com/honeyvig Hire a web Developer and Designer to upgrade and boost your online presence with cutting edge Technologies
Showing posts with label Core Web vitals. Show all posts

Monday, November 17, 2025

Web 2.0 and Web 3.0


What Are Web 2.0 and Web 3.0?

Web 2.0 and Web 3.0 refer to successive iterations of the web, compared with the original Web 1.0 of the 1990s and early 2000s. Web 2.0 is the current version of the internet (a term often used interchangeably with the web) with which we are all familiar, while Web 3.0 represents its next phase.

Web refers to the World Wide Web (WWW), the internet’s core information retrieval system. The WWW initialism used to (and often still does) preface a web address and was one of the first characters typed into a web browser when searching for a specific resource online. Internet pioneer Tim Berners-Lee is credited with coining the term World Wide Web to refer to the global web of information and resources interconnected through hypertext links.1

KEY TAKEAWAYS

  • Web 2.0 and Web 3.0 represent successive, advanced iterations of the original Web 1.0 of the 1990s and early 2000s. Web 2.0 is the current version of the web with which we are all familiar, while Web 3.0 represents its next phase, which will be decentralized, open, and of greater utility.
  • Innovations such as smartphones, mobile internet access, and social networks have driven the exponential growth of Web 2.0.
  • Web 2.0 has disrupted sectors that fail to integrate the new web-based business model.
  • Defining features of Web 3.0 include decentralization; trustlessness and permissionlessness; artificial intelligence (AI) and machine learning; and connectivity and ubiquity.

Web 1.0

Berners-Lee pioneered the early development of the internet in 1990 when he was a computer scientist at European researcher CERN.2 By October 1990, Berners-Lee had written the three fundamental technologies that became the foundation of the web, including the very first webpage editor/browser (WorldWideWeb.app):

  • HTML: HyperText Markup Language, the markup or formatting language of the web
  • URI or URL: Uniform Resource Identifier or Locator, a unique address used to identify each resource on the web
  • HTTP: HyperText Transfer Protocol, which allows for the retrieval of linked resources from across the web3

By the mid-1990s, the introduction of web browsers such as Netscape Navigator ushered in the era of Web 1.0. This was the age of static webpages retrieved from servers, a far cry from the slick content that is taken for granted today. Most internet users at that time were delighted by the novelty of features such as email and real-time news retrieval. Content creation was still in its infancy, and users had little opportunity for interactive applications, although this improved as online banking and trading became increasingly popular.

Web 2.0

Web 2.0 refers to a paradigm shift in how the internet is used. Over the past 15 to 20 years, the bland webpages of Web 1.0 have been completely replaced by Web 2.0’s interactivity, social connectivity, and user-generated content. Web 2.0 makes it possible for user-generated content to be viewed by millions of people around the world virtually in an instant; this unparalleled reach has led to an explosion of this type of content in recent years.

The exponential growth of Web 2.0 has been driven by key innovations such as mobile internet access and social networks, as well as the near-ubiquity of powerful mobile devices like iPhones and Android-powered devices. In the second decade of this millennium, these developments enabled the dominance of apps that greatly expanded online interactivity and utility—for example, AirbnbFacebook, Instagram, TikTokTwitterUber, WhatsApp, and YouTube, to name a few.

The phenomenal revenue growth of these dominant platforms has made many of the Web 2.0-centric companies—such as AppleAmazonGoogle, Meta (formerly Facebook), and Netflix—among the world’s biggest companies by market capitalization (there is even an acronym for them: FAANG).

These applications have also spurred the growth of the gig economy, by enabling millions of people to earn income on a part-time or full-time basis by driving, renting their homes, delivering food and groceries, or selling goods and services online. Web 2.0 has also been tremendously disruptive to certain industries to the point of being an existential threat to some of them. These are sectors that have either failed to adapt to the new web-centric business model or been slow to do so, with retail, entertainment, media, and advertising among the hardest hit.

2004

This year witnessed two notable developments that accelerated the development and adoption of Web 2.0: Google’s initial public offering (IPO) and the creation of Facebook (now Meta)5 Both companies are part of the FAANG group, which consists of the biggest U.S. technology giants.

Web 3.0

Web 3.0 represents the next iteration or phase of the evolution of the web/internet and potentially could be as disruptive and represent as big a paradigm shift as Web 2.0 did. Web 3.0 is built upon the core concepts of decentralization, openness, and greater user utility.

Berners-Lee had expounded upon some of these key concepts back in the 1990s, as outlined below:

  • Decentralization: “No permission is needed from a central authority to post anything on the web, there is no central controlling node, and so no single point of failure...and no ‘kill switch’! This also implies freedom from indiscriminate censorship and surveillance.”
  • Bottom-up design: “Instead of code being written and controlled by a small group of experts, it was developed in full view of everyone, encouraging maximum participation and experimentation.”

In a 2001 paper, Berners-Lee discussed the concept of what he referred to as the Semantic Web.6 Computers have no reliable way to process the semantics of language (i.e., figure out the actual context in which a word or phrase is used). Berners-Lee’s vision for the Semantic Web was to bring structure to the meaningful content of webpages and enable software that would carry out sophisticated tasks for users.

Web 3.0 has moved well beyond the original concept of the Semantic Web as conceptualized by Berners-Lee in 2001. This is partly because it is very expensive and monumentally difficult to convert human language—with all its subtle nuances and variations—into a format that can be readily understood by computers, and because Web 2.0 has already evolved substantially over the past two decades.

Defining Features of Web 3.0

Though there is as yet no standardized definition of Web 3.0, it does have a few defining features:

Decentralization: This is a core tenet of Web 3.0. In Web 2.0, computers use HTTP in the form of unique web addresses to find information, which is stored at a fixed location, generally on a single server. With Web 3.0, because information would be found based on its content, it could be stored in multiple locations simultaneously and hence be decentralized. This would break down the massive databases currently held by internet giants like Meta and Google and would hand greater control to users.

With Web 3.0, the data generated by disparate and increasingly powerful computing resources, including mobile phones, desktops, appliances, vehicles, and sensors, will be sold by users through decentralized data networks, ensuring that users retain ownership control.

Trustless and permissionless: In addition to decentralization and being based upon open source software, Web 3.0 will also be trustless (i.e., the network will allow participants to interact directly without going through a trusted intermediary) and permissionless (meaning that anyone can participate without authorization from a governing body). As a result, Web 3.0 applications will run on blockchains or decentralized peer-to-peer networks, or a combination thereof—such decentralized apps are referred to as dApps.

Artificial intelligence (AI) and machine learning: In Web 3.0, computers will be able to understand information similarly to humans, through technologies based upon Semantic Web concepts and natural language processing. Web 3.0 will also use machine learning, which is a branch of artificial intelligence (AI) that uses data and algorithms to imitate how humans learn, gradually improving its accuracy. These capabilities will enable computers to produce faster and more relevant results in a host of areas like drug development and new materials, as opposed to merely targeted advertising that forms the bulk of current efforts.

Connectivity and ubiquity: With Web 3.0, information and content are more connected and ubiquitous, accessed by multiple applications and with an increasing number of everyday devices connected to the web—one example of which is the Internet of Things.

Potential and Pitfalls of Web 3.0

Web 3.0 has the potential to provide users with far greater utility, going well beyond the social media, streaming, and online shopping that comprise the majority of Web 2.0 applications consumers use. Capabilities like Semantic Web, AI, and machine learning, which are at the core of Web 3.0, have the potential to greatly increase application in new areas and vastly improve user interaction.

Core features of Web 3.0, such as decentralization and permissionless systems, will also give users much greater control over their personal data. This may help limit the practice of data extraction—which refers to information collected from web users without their consent or compensation—and curb the network effects that have enabled the technology giants to become near-monopolies through exploitative advertising and marketing practices.

However, decentralization also brings with it significant legal and regulatory risks. Cybercrime, hate speech, and misinformation are already difficult to police and will become even more so in a decentralized structure because of the lack of central control. A decentralized web would also make regulation and enforcement very difficult; for example, which country’s laws would apply to a specific website whose content is hosted in numerous nations globally?

Is Web 3.0 the Same as the Semantic Web?

Web 3.0 goes well beyond the Semantic Web envisioned by web pioneer Tim Berners-Lee in 2001. Though Web 3.0 uses technologies based on Semantic Web concepts and natural language processing to make user interaction more intuitive, it also has other features, such as widespread use of artificial intelligence (AI) and machine learning, and trustless/permissionless systems, such as blockchain and peer-to-peer networks.

Which Newer Technologies in Finance Will Be Facilitated by Web 3.0?

Because of its key decentralization feature, Web 3.0 lends itself to technologies such as blockchain, distributed ledger, and decentralized finance (DeFi).

What’s a Real-World Example of How Web 3.0 Will Be Able to Provide Greater User Utility?

For example, if you are making plans for a vacation and are on a budget, you currently would have to spend hours looking for flights, accommodation, and car rentals, trawling through numerous websites and comparing prices. With Web 3.0, intelligent search engines or bots will be able to collate all this information and generate tailored recommendations based on your profile and preferences, saving you hours of work.

The Bottom Line

To use an analogy from the movies, if Web 1.0 represented the black-and-white movie era, Web 2.0 would be the age of color/basic 3D, while Web 3.0 would be immersive experiences in the metaverse. Just as the 2010s were the decade when Web 2.0 became the dominant force in the global business and cultural landscape, it might be Web 3.0’s turn in the 2020s. Facebook’s name change to Meta on Oct. 28, 2021, could well turn out to be an early sign that the shift to Web 3.0 is picking up steam.

Friday, November 22, 2024

Why Optimizing Your Lighthouse Score Is Not Enough For A Fast Website

 Feeling good with your Lighthouse score of 100%? You should! But you should also know that you’re only looking at part of the performance picture. Learn how Lighthouse scores are measured differently than other tools, the impact that has on measuring performance metrics, and why you need real-user monitoring for a complete picture.We’ve all had that moment. You’re optimizing the performance of some website, scrutinizing every millisecond it takes for the current page to load. You’ve fired up Google Lighthouse from Chrome’s DevTools because everyone and their uncle uses it to evaluate performance.

After running your 151st report and completing all of the recommended improvements, you experience nirvana: a perfect 100% performance score!

Time to pat yourself on the back for a job well done. Maybe you can use this to get that pay raise you’ve been wanting! Except, don’t — at least not using Google Lighthouse as your sole proof. I know a perfect score produces all kinds of good feelings. That’s what we’re aiming for, after all!

Google Lighthouse is merely one tool in a complete performance toolkit. What it’s not is a complete picture of how your website performs in the real world. Sure, we can glean plenty of insights about a site’s performance and even spot issues that ought to be addressed to speed things up. But again, it’s an incomplete picture.

What Google Lighthouse Is Great At #

I hear other developers boasting about perfect Lighthouse scores and see the screenshots published all over socials. Hey, I just did that myself in the introduction of this article!

Lighthouse might be the most widely used web performance reporting tool. I’d wager its ubiquity is due to convenience more than the quality of its reports.

Open DevTools, click the Lighthouse tab, and generate the report! There are even many ways we can configure Lighthouse to measure performance in simulated situations, such as slow internet connection speeds or creating separate reports for mobile and desktop. It’s a very powerful tool for something that comes baked into a free browser. It’s also baked right into Google’s PageSpeed Insights tool!

And it’s fast. Run a report in Lighthouse, and you’ll get something back in about 10-15 seconds. Try running reports with other tools, and you’ll find yourself refilling your coffee, hitting the bathroom, and maybe checking your email (in varying order) while waiting for the results. There’s a good reason for that, but all I want to call out is that Google Lighthouse is lightning fast as far as performance reporting goes.

To recap: Lighthouse is great at many things!

  • It’s convenient to access,
  • It provides a good deal of configuration for different levels of troubleshooting,
  • And it spits out reports in record time.

And what about that bright and lovely animated green score — who doesn’t love that?!

OK, that’s the rosy side of Lighthouse reports. It’s only fair to highlight its limitations as well. This isn’t to dissuade you or anyone else from using Lighthouse, but more of a heads-up that your score may not perfectly reflect reality — or even match the scores you’d get in other tools, including Google’s own PageSpeed Insights.

It Doesn’t Match “Real” Users #

Not all data is created equal in capital Web Performance. It’s important to know this because data represents assumptions that reporting tools make when evaluating performance metrics.

The data Lighthouse relies on for its reporting is called simulated data. You might already have a solid guess at what that means: it’s synthetic data. Now, before kicking simulated data in the knees for not being “real” data, know that it’s the reason Lighthouse is super fast.

You know how there’s a setting to “throttle” the internet connection speed? That simulates different conditions that either slow down or speed up the connection speed, something that you configure directly in Lighthouse. By default, Lighthouse collects data on a fast connection, but we can configure it to something slower to gain insights on slow page loads. But beware! Lighthouse then estimates how quickly the page would have loaded on a different connection.

DebugBear founder Matt Zeunert outlines how data runs in a simulated throttling environment, explaining how Lighthouse uses “optimistic” and “pessimistic” averages for making conclusions:

“[Simulated throttling] reduces variability between tests. But if there’s a single slow render-blocking request that shares an origin with several fast responses, then Lighthouse will underestimate page load time.

Lighthouse averages optimistic and pessimistic estimates when it’s unsure exactly which nodes block rendering. In practice, metrics may be closer to either one of these, depending on which dependency graph is more correct.”

And again, the environment is a configuration, not reality. It’s unlikely that your throttled conditions match the connection speeds of an average real user on the website, as they may have a faster network connection or run on a slower CPU. What Lighthouse provides is more like “on-demand” testing that’s immediately available.

That makes simulated data great for running tests quickly and under certain artificially sweetened conditions. However, it sacrifices accuracy by making assumptions about the connection speeds of site visitors and averages things in a way that divorces it from reality.

While simulated throttling is the default in Lighthouse, it also supports more realistic throttling methods. Running those tests will take more time but give you more accurate data. The easiest way to run Lighthouse with more realistic settings is using an online tool like the DebugBear website speed test or WebPageTest.

It Doesn’t Impact Core Web Vitals Scores #

These Core Web Vitals everyone talks about are Google’s standard metrics for measuring performance. They go beyond simple “Your page loaded in X seconds” reports by looking at a slew of more pertinent details that are diagnostic of how the page loads, resources that might be blocking other resources, slow user interactions, and how much the page shifts around from loading resources and content. Zeunert has another great post here on Smashing Magazine that discusses each metric in detail.

The main point here is that the simulated data Lighthouse produces may (and often does) differ from performance metrics from other tools. I spent a good deal explaining this in another article. The gist of it is that Lighthouse scores do not impact Core Web Vitals data. The reason for that is Core Web Vitals relies on data about real users pulled from the monthly-updated Chrome User Experience (CrUX) report. While CrUX data may be limited by how recently the data was pulled, it is a more accurate reflection of user behaviors and browsing conditions than the simulated data in Lighthouse.

The ultimate point I’m getting at is that Lighthouse is simply ineffective at measuring Core Web Vitals performance metrics. Here’s how I explain it in my bespoke article:

“[Synthetic] data is fundamentally limited by the fact that it only looks at a single experience in a pre-defined environment. This environment often doesn’t even match the average real user on the website, who may have a faster network connection or a slower CPU.”

I emphasized the important part. In real life, users are likely to have more than one experience on a particular page. It’s not as though you navigate to a site, let it load, sit there, and then close the page; you’re more likely to do something on that page. And for a Core Web Vital metric that looks for slow paint in response to user input — namely, Interaction to Next Paint (INP) — there’s no way for Lighthouse to measure that at all!

It’s the same deal for a metric like Cumulative Layout Shift (CLS) that measures the “visible stability” of a page layout because layout shifts often happen lower on the page after a user has scrolled down. If Lighthouse relied on CrUX data (which it doesn’t), then it would be able to make assumptions based on real users who interact with the page and can experience CLS. Instead, Lighthouse waits patiently for the full page load and never interacts with parts of the page, thus having no way of knowing anything about CLS.

But It’s Still a “Good Start” #

That’s what I want you to walk away with at the end of the day. A Lighthouse report is incredibly good at producing reports quickly, thanks to the simulated data it uses. In that sense, I’d say that Lighthouse is a handy “gut check” and maybe even a first step to identifying opportunities to optimize performance.

But a complete picture, it’s not. For that, what we’d want is a tool that leans on real user data. Tools that integrate CrUX data are pretty good there. But again, that data is pulled every month (28 days to be exact) so it may not reflect the most recent user behaviors and interactions, although it is updated daily on a rolling basis and it is indeed possible to query historical records for larger sample sizes.

Even better is using a tool that monitors users in real-time.

Data pulled directly from the site of origin is truly the gold standard data we want because it comes from the source of truth. That makes tools that integrate with your site the best way to gain insights and diagnose issues because they tell you exactly how your visitors are experiencing your site.

I’ve written about using the Performance API in JavaScript to evaluate custom and Core Web Vitals metrics, so it’s possible to roll that on your own. But there are plenty of existing services out there that do this for you, complete with visualizations, historical records, and true real-time user monitoring (often abbreviated as RUM). What services? Well, DebugBear is a great place to start. I cited Matt Zeunert earlier, and DebugBear is his product.

So, if what you want is a complete picture of your site’s performance, go ahead and start with Lighthouse. But don’t stop there because you’re only seeing part of the picture. You’ll want to augment your findings and diagnose performance with real-user monitoring for the most complete, accurate picture.


Thursday, April 25, 2024

How To Monitor And Optimize Google Core Web Vitals

 The three Core Web Vitals metrics don’t only tell you how visitors experience your website but also impact your Google search result rankings. In this article, we’ll look at what Core Web Vitals are, how they are measured, and how you can use DebugBear to monitor them continuously.

Google’s Core Web Vitals initiative has increased the attention website owners need to pay to user experience. You can now more easily see when users have poor experiences on your website, and poor UX also has a bigger impact on SEO.

That means you need to test your website to identify optimizations. Beyond that, monitoring ensures that you can stay ahead of your Core Web Vitals scores for the long term.

Let’s find out how to work with different types of Core Web Vitals data and how monitoring can help you gain a deeper insight into user experiences and help you optimize them.

What Are Core Web Vitals?

There are three web vitals metrics Google uses to measure different aspects of website performance:

  • Largest Contentful Paint (LCP),
  • Cumulative Layout Shift (CLS),
  • Interaction to Next Paint (INP).
Three web vitals metrics that measure different aspects of website performance
(Large preview)

Largest Contentful Paint (LCP) #

The Largest Contentful Paint metric is the closest thing to a traditional load time measurement. However, LCP doesn’t track a purely technical page load milestone like the JavaScript Load Event. Instead, it focuses on what the user can see by measuring how soon after opening a page, the largest content element on the page appears.

The faster the LCP happens, the better, and Google rates a passing LCP score below 2.5 seconds.

Largest Contentful Paint
(Large preview)

Cumulative Layout Shift (CLS)

Cumulative Layout Shift is a bit of an odd metric, as it doesn’t measure how fast something happens. Instead, it looks at how stable the page layout is once the page starts loading. Layout shifts mean that content moves around, disorienting the user and potentially causing accidental clicks on the wrong UI element.

The CLS score is calculated by looking at how far an element moved and how big the element is. Aim for a score below 0.1 to get a good rating from Google.

Cumulative Layout Shift
(Large preview)

Interaction to Next Paint (INP)

Even websites that load quickly often frustrate users when interactions with the page feel sluggish. That’s why Interaction to Next Paint measures how long the page remains frozen after user interaction with no visual updates.

Page interactions should feel practically instant, so Google recommends an INP score below 200 milliseconds.

Interaction to Next Paint
(Large preview)

What Are The Different Types Of Core Web Vitals Data?

You’ll often see different page speed metrics reported by different tools and data sources, so it’s important to understand the differences. We’ve published a whole article just about that, but here’s the high-level breakdown along with the pros and cons of each one:

  • Synthetic Tests
    These tests are run on-demand in a controlled lab environment in a fixed location with a fixed network and device speed. They can produce very detailed reports and recommendations.
  • Real User Monitoring (RUM)
    This data tells you how fast your website is for your actual visitors. That means you need to install an analytics script to collect it, and the reporting that’s available is less detailed than for lab tests.
  • CrUX Data
    Google collects from Chrome users as part of the Chrome User Experience Report (CrUX) and uses it as a ranking signal. It’s available for every website with enough traffic, but since it covers a 28-day rolling window, it takes a while for changes on your website to be reflected here. It also doesn’t include any debug data to help you optimize your metrics.

Start By Running A One-Off Page Speed Test #

Before signing up for a monitoring service, it’s best to run a one-off lab test with a free tool like Google’s PageSpeed Insights or the DebugBear Website Speed Test. Both of these tools report with Google CrUX data that reflects whether real users are facing issues on your website.

Note: The lab data you get from some Lighthouse-based tools — like PageSpeed Insights — can be unreliable.

One-Off Page Speed Test with DebugBear
(Large preview)

INP is best measured for real users, where you can see the elements that users interact with most often and where the problems lie. But a free tool like the INP Debugger can be a good starting point if you don’t have RUM set up yet.

How To Monitor Core Web Vitals Continuously With Scheduled Lab-Based Testing #

Running tests continuously has a few advantages over ad-hoc tests. Most importantly, continuous testing triggers alerts whenever a new issue appears on your website, allowing you to start fixing them right away. You’ll also have access to historical data, allowing you to see exactly when a regression occurred and letting you compare test results before and after to see what changed.

Scheduled lab tests are easy to set up using a website monitoring tool like DebugBear. Enter a list of website URLs and pick a device type, test location, and test frequency to get things running:

A screenshot of how to schedule lab-based testing with DebugBear
(Large preview)

As this process runs, it feeds data into the detailed dashboard with historical Core Web Vitals data. You can monitor a number of pages on your website or track the speed of your competition to make sure you stay ahead.

An example of detailed dashboard with historical Core Web Vitals data
(Large preview)

When regression occurs, you can dive deep into the results using DebuBears’s Compare mode. This mode lets you see before-and-after test results side-by-side, giving you context for identifying causes. You see exactly what changed. For example, in the following case, we can see that HTTP compression stopped working for a file, leading to an increase in page weight and longer download times.

A screenshot with DebuBears’s Compare mode
(Large preview)

How To Monitor Real User Core Web Vitals

Synthetic tests are great for super-detailed reporting of your page load time. However, other aspects of user experience, like layout shifts and slow interactions, heavily depend on how real users use your website. So, it’s worth setting up real user monitoring with a tool like DebugBear.

To monitor real user web vitals, you’ll need to install an analytics snippet that collects this data on your website. Once that’s done, you’ll be able to see data for all three Core Web Vitals metrics across your entire website.

An analytics snippet to monitor real user web vitals with DebugBear
(Large preview)

To optimize your scores, you can go into the dashboard for each individual metric, select a specific page you’re interested in, and then dive deeper into the data.

For example, you can see whether a slow LCP score is caused by a slow server response, render blocking resources, or by the LCP content element itself.

You’ll also find that the LCP element varies between visitors. Lab test results are always the same, as they rely on a single fixed screen size. However, in the real world, visitors use a wide range of devices and will see different content when they open your website.

An example of a dashboard for the LCP metric with data reflecting the LCP score
(Large preview)

INP is tricky to debug without real user data. Yet an analytics tool like DebugBear can tell you exactly what page elements users are interacting with most often and which of these interactions are slow to respond.

INP elements
(Large preview)

Thanks to the new Long Animation Frames API, we can also see specific scripts that contribute to slow interactions. We can then decide to optimize these scripts, remove them from the page, or run them in a way that does not block interactions for as long.

Long Animation Frames API with a list of INP primary scripts that slow interactions
(Large preview)

Conclusion #

Continuously monitoring Core Web Vitals lets you see how website changes impact user experience and ensures you get alerted when something goes wrong. While it’s possible to measure Core Web Vitals using a wide range of tools, those tools are limited by the type of data they use to evaluate performance, not to mention they only provide a single snapshot of performance at a specific point in time.

A tool like DebugBear gives you access to several different types of data that you can use to troubleshoot performance and optimize your website, complete with RUM capabilities that offer a historial record of performance for identifying issues where and when they occur. Sign up for a free DebugBear trial here.

Reporting Core Web Vitals With The Performance API

 The Performance API is a set of standards for measuring and evaluating performance metrics with JavaScript. Think of it as a box containing all of the same functionality for reporting on Core Web Vitals and general performance statistics that you’d get in many performance testing tools. This article demonstrates how to use the Performance API to generate performance metrics directly in the DOM to create your own reporting.

There’s quite a buzz in the performance community with the Interaction to Next Paint (INP) metric becoming an official Core Web Vitals (CWV) metric in a few short weeks. If you haven’t heard, INP is replacing the First Input Delay (FID) metric, something you can read all about here on Smashing Magazine as a guide to prepare for the change.

But that’s not what I really want to talk about. With performance at the forefront of my mind, I decided to head over to MDN for a fresh look at the Performance API. We can use it to report the load time of elements on the page, even going so far as to report on Core Web Vitals metrics in real time. Let’s look at a few ways we can use the API to report some CWV metrics.

Browser Support Warning #

Before we get started, a quick word about browser support. The Performance API is huge in that it contains a lot of different interfaces, properties, and methods. While the majority of it is supported by all major browsers, Chromium-based browsers are the only ones that support all of the CWV properties. The only other is Firefox, which supports the First Contentful Paint (FCP) and Largest Contentful Paint (LCP) API properties.

So, we’re looking at a feature of features, as it were, where some are well-established, and others are still in the experimental phase. But as far as Core Web Vitals go, we’re going to want to work in Chrome for the most part as we go along.

First, We Need Data Access #

There are two main ways to retrieve the performance metrics we care about:

  1. Using the performance.getEntries() method, or
  2. Using a PerformanceObserver instance.

Using a PerformanceObserver instance offers a few important advantages:

  • PerformanceObserver observes performance metrics and dispatches them over time. Instead, using performance.getEntries() will always return the entire list of entries since the performance metrics started being recorded.
  • PerformanceObserver dispatches the metrics asynchronously, which means they don’t have to block what the browser is doing.
  • The element performance metric type doesn’t work with the performance.getEntries() method anyway.

That all said, let’s create a PerformanceObserver:

const lcpObserver = new PerformanceObserver(list => {});

For now, we’re passing an empty callback function to the PerformanceObserver constructor. Later on, we’ll change it so that it actually does something with the observed performance metrics. For now, let’s start observing:

lcpObserver.observe({ type: "largest-contentful-paint", buffered: true });

The first very important thing in that snippet is the buffered: true property. Setting this to true means that we not only get to observe performance metrics being dispatched after we start observing, but we also want to get the performance metrics that were queued by the browser before we started observing.

The second very important thing to note is that we’re working with the largest-contentful-paint property. That’s what’s cool about the Performance API: it can be used to measure very specific things but also supports properties that are mapped directly to CWV metrics. We’ll start with the LCP metric before looking at other CWV metrics.

Reporting The Largest Contentful Paint #

The largest-contentful-paint property looks at everything on the page, identifying the biggest piece of content on the initial view and how long it takes to load. In other words, we’re observing the full page load and getting stats on the largest piece of content rendered in view.

We already have our Performance Observer and callback:

const lcpObserver = new PerformanceObserver(list => {});
lcpObserver.observe({ type: "largest-contentful-paint", buffered: true });

Let’s fill in that empty callback so that it returns a list of entries once performance measurement starts:

// The Performance Observer
const lcpObserver = new PerformanceObserver(list => {
  // Returns the entire list of entries
  const entries = list.getEntries();
});

// Call the Observer
lcpObserver.observe({ type: "largest-contentful-paint", buffered: true });

Next, we want to know which element is pegged as the LCP. It’s worth noting that the element representing the LCP is always the last element in the ordered list of entries. So, we can look at the list of returned entries and return the last one:

// The Performance Observer
const lcpObserver = new PerformanceObserver(list => {
  // Returns the entire list of entries
  const entries = list.getEntries();
  // The element representing the LCP
  const el = entries[entries.length - 1];
});

// Call the Observer
lcpObserver.observe({ type: "largest-contentful-paint", buffered: true });

The last thing is to display the results! We could create some sort of dashboard UI that consumes all the data and renders it in an aesthetically pleasing way. Let’s simply log the results to the console rather than switch gears.

// The Performance Observer
const lcpObserver = new PerformanceObserver(list => {
  // Returns the entire list of entries
  const entries = list.getEntries();
  // The element representing the LCP
  const el = entries[entries.length - 1];
  
  // Log the results in the console
  console.log(el.element);
});

// Call the Observer
lcpObserver.observe({ type: "largest-contentful-paint", buffered: true });

There we go!

Open Chrome window showing the LCP results in the DevTools console while highlighting the result on the Smashing Magazine homepage.
LCP support is limited to Chrome and Firefox at the time of writing. (Large preview)

It’s certainly nice knowing which element is the largest. But I’d like to know more about it, say, how long it took for the LCP to render:

// The Performance Observer
const lcpObserver = new PerformanceObserver(list => {

  const entries = list.getEntries();
  const lcp = entries[entries.length - 1];

  entries.forEach(entry => {
    // Log the results in the console
    console.log(
      `The LCP is:`,
      lcp.element,
      `The time to render was ${entry.startTime} milliseconds.`,
    );
  });
});

// Call the Observer
lcpObserver.observe({ type: "largest-contentful-paint", buffered: true });

// The LCP is:
// <h2 class="author-post__title mt-5 text-5xl">…</h2>
// The time to  render was 832.6999999880791 milliseconds.

Reporting First Contentful Paint #

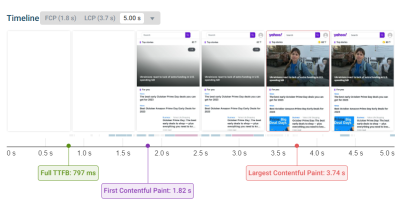
This is all about the time it takes for the very first piece of DOM to get painted on the screen. Faster is better, of course, but the way Lighthouse reports it, a “passing” score comes in between 0 and 1.8 seconds.

Showing a timeline of mobile screen frames measured in seconds and how much is painted to the screen at various intervals.
Image source: Source: DebugBear. (Large preview)

Just like we set the type property to largest-contentful-paint to fetch performance data in the last section, we’re going to set a different type this time around: paint.

When we call paint, we tap into the PerformancePaintTiming interface that opens up reporting on first paint and first contentful paint.

// The Performance Observer
const paintObserver = new PerformanceObserver(list => {
  const entries = list.getEntries();
  entries.forEach(entry => {    
    // Log the results in the console.
    console.log(
      `The time to ${entry.name} took ${entry.startTime} milliseconds.`,
    );
  });
});

// Call the Observer.
paintObserver.observe({ type: "paint", buffered: true });

// The time to first-paint took 509.29999999981374 milliseconds.
// The time to first-contentful-paint took 509.29999999981374 milliseconds.
DevTools open on the Smashing Magazine website displaying the paint results in the console.
(Large preview)

Notice how paint spits out two results: one for the first-paint and the other for the first-contenful-paint. I know that a lot happens between the time a user navigates to a page and stuff starts painting, but I didn’t know there was a difference between these two metrics.

Here’s how the spec explains it:

“The primary difference between the two metrics is that [First Paint] marks the first time the browser renders anything for a given document. By contrast, [First Contentful Paint] marks the time when the browser renders the first bit of image or text content from the DOM.”

As it turns out, the first paint and FCP data I got back in that last example are identical. Since first paint can be anything that prevents a blank screen, e.g., a background color, I think that the identical results mean that whatever content is first painted to the screen just so happens to also be the first contentful paint.

But there’s apparently a lot more nuance to it, as Chrome measures FCP differently based on what version of the browser is in use. Google keeps a full record of the changelog for reference, so that’s something to keep in mind when evaluating results, especially if you find yourself with different results from others on your team.

Reporting Cumulative Layout Shift #

How much does the page shift around as elements are painted to it? Of course, we can get that from the Performance API! Instead of largest-contentful-paint or paint, now we’re turning to the layout-shift type.

This is where browser support is dicier than other performance metrics. The LayoutShift interface is still in “experimental” status at this time, with Chromium browsers being the sole group of supporters.

As it currently stands, LayoutShift opens up several pieces of information, including a value representing the amount of shifting, as well as the sources causing it to happen. More than that, we can tell if any user interactions took place that would affect the CLS value, such as zooming, changing browser size, or actions like keydown, pointerdown, and mousedown. This is the lastInputTime property, and there’s an accompanying hasRecentInput boolean that returns true if the lastInputTime is less than 500ms.

Got all that? We can use this to both see how much shifting takes place during page load and identify the culprits while excluding any shifts that are the result of user interactions.

const observer = new PerformanceObserver((list) => {
  let cumulativeLayoutShift = 0;
  list.getEntries().forEach((entry) => {
    // Don't count if the layout shift is a result of user interaction.
    if (!entry.hadRecentInput) {
      cumulativeLayoutShift += entry.value;
    }
    console.log({ entry, cumulativeLayoutShift });
  });
});

// Call the Observer.
observer.observe({ type: "layout-shift", buffered: true });

Given the experimental nature of this one, here’s what an entry object looks like when we query it:

Tree outline showing the object properties and values for entries in the LayoutShift class produced by a query.
(Large preview)

Pretty handy, right? Not only are we able to see how much shifting takes place (0.128) and which element is moving around (article.a.main), but we have the exact coordinates of the element’s box from where it starts to where it ends.

Reporting Interaction To Next Paint #

This is the new kid on the block that got my mind wondering about the Performance API in the first place. It’s been possible for some time now to measure INP as it transitions to replace First Input Delay as a Core Web Vitals metric in March 2024. When we’re talking about INP, we’re talking about measuring the time between a user interacting with the page and the page responding to that interaction.

Timeline illustration showing the tasks in between input delay and presentation delay in response to user interaction.
(Large preview)

We need to hook into the PerformanceEventTiming class for this one. And there’s so much we can dig into when it comes to user interactions. Think about it! There’s what type of event happened (entryType and name), when it happened (startTime), what element triggered the interaction (interactionId, experimental), and when processing the interaction starts (processingStart) and ends (processingEnd). There’s also a way to exclude interactions that can be canceled by the user (cancelable).

const observer = new PerformanceObserver((list) => {
  list.getEntries().forEach((entry) => {
    // Alias for the total duration.
    const duration = entry.duration;
    // Calculate the time before processing starts.
    const delay = entry.processingStart - entry.startTime;
    // Calculate the time to process the interaction.
    const lag = entry.processingStart - entry.startTime;

    // Don't count interactions that the user can cancel.
    if (!entry.cancelable) {
      console.log(`INP Duration: ${duration}`);
      console.log(`INP Delay: ${delay}`);
      console.log(`Event handler duration: ${lag}`);
    }
  });
});

// Call the Observer.
observer.observe({ type: "event", buffered: true });

Reporting Long Animation Frames (LoAFs) #

Let’s build off that last one. We can now track INP scores on our website and break them down into specific components. But what code is actually running and causing those delays?

The Long Animation Frames API was developed to help answer that question. It won’t land in Chrome stable until mid-March 2024, but you can already use it in Chrome Canary.

A long-animation-frame entry is reported every time the browser couldn’t render page content immediately as it was busy with other processing tasks. We get an overall duration for the long frame but also a duration for different scripts involved in the processing.

const observer = new PerformanceObserver((list) => {
  list.getEntries().forEach((entry) => {
    if (entry.duration > 50) {
      // Log the overall duration of the long frame.
      console.log(`Frame took ${entry.duration} ms`)
      console.log(`Contributing scripts:`)
      // Log information on each script in a table.
      entry.scripts.forEach(script => {
        console.table({
          // URL of the script where the processing starts
          sourceURL: script.sourceURL,
          // Total time spent on this sub-task
          duration: script.duration,
          // Name of the handler function
          functionName: script.sourceFunctionName,
          // Why was the handler function called? For example, 
          // a user interaction or a fetch response arriving.
          invoker: script.invoker
        })
      })
    }
  });
});

// Call the Observer.
observer.observe({ type: "long-animation-frame", buffered: true });

When an INP interaction takes place, we can find the closest long animation frame and investigate what processing delayed the page response.

Long animation frames data the Chrome DevTools Console
(Large preview)

There’s A Package For This #

The Performance API is so big and so powerful. We could easily spend an entire bootcamp learning all of the interfaces and what they provide. There’s network timing, navigation timing, resource timing, and plenty of custom reporting features available on top of the Core Web Vitals we’ve looked at.

If CWVs are what you’re really after, then you might consider looking into the web-vitals library to wrap around the browser Performance APIs.

Need a CWV metric? All it takes is a single function.

webVitals.getINP(function(info) {
  console.log(info)
}, { reportAllChanges: true });

Boom! That reportAllChanges property? That’s a way of saying we only want to report data every time the metric changes instead of only when the metric reaches its final value. For example, as long as the page is open, there’s always a chance that the user will encounter an even slower interaction than the current INP interaction. So, without reportAllChanges, we’d only see the INP reported when the page is closed (or when it’s hidden, e.g., if the user switches to a different browser tab).

We can also report purely on the difference between the preliminary results and the resulting changes. From the web-vitals docs:

function logDelta({ name, id, delta }) {
  console.log(`${name} matching ID ${id} changed by ${delta}`);
}

onCLS(logDelta);
onINP(logDelta);
onLCP(logDelta);

Measuring Is Fun, But Monitoring Is Better #

All we’ve done here is scratch the surface of the Performance API as far as programmatically reporting Core Web Vitals metrics. It’s fun to play with things like this. There’s even a slight feeling of power in being able to tap into this information on demand.

At the end of the day, though, you’re probably just as interested in monitoring performance as you are in measuring it. We could do a deep dive and detail what a performance dashboard powered by the Performance API is like, complete with historical records that indicate changes over time. That’s ultimately the sort of thing we can build on this — we can build our own real user monitoring (RUM) tool or perhaps compare Performance API values against historical data from the Chrome User Experience Report (CrUX).

Or perhaps you want a solution right now without stitching things together. That’s what you’ll get from a paid commercial service like DebugBear. All of this is already baked right in with all the metrics, historical data, and charts you need to gain insights into the overall performance of a site over time… and in real-time, monitoring real users.

DebugBear Largest Contentful Paint dashboard showing overall speed, a histogram, a  timeline, and a performance breakdown of the most popular pages.
(Large preview)

DebugBear can help you identify why users are having slow experiences on any given page. If there is slow INP, what page elements are these users interacting with? What elements often shift around on the page and cause high CLS? Is the LCP typically an image, a heading, or something else? And does the type of LCP element impact the LCP score?

To help explain INP scores, DebugBear also supports the upcoming Long Animation Frames API we looked at, allowing you to see what code is responsible for interaction delays.

Table showing CSS selectors identifying different page elements that users have interacted with, along with their INP score.
(Large preview)

The Performance API can also report a list of all resource requests on a page. DebugBear uses this information to show a request waterfall chart that tells you not just when different resources are loaded but also whether the resources were render-blocking, loaded from the cache or whether an image resource is used for the LCP element.

In this screenshot, the blue line shows the FCP, and the red line shows the LCP. We can see that the LCP happens right after the LCP image request, marked by the blue “LCP” badge, has finished.

A request waterfall visualization showing what resources are loaded by a website and when they are loaded.
(Large preview)

DebugBear offers a 14-day free trial. See how fast your website is, what’s slowing it down, and how you can improve your Core Web Vitals. You’ll also get monitoring alerts, so if there’s a web vitals regression, you’ll find out before it starts impacting Google search results.