What does your performance “stack” look like? There are all kinds of tools available for measuring page speed, but what data and assumptions do they use to measure performance? And speaking of measuring performance, there’s quite a difference between that and monitoring performance. Geoff Graham evaluates the data of different tools for measuring page speed performance and looks specifically at DebugBear, a commercial offering, that pulls together the best metrics for not only measuring performance, but monitoring it over time as well.
This article has been kindly supported by our dear friends at DebugBear who help optimize web performance to improve user experience. Thank you!
There is no shortage of ways to measure the speed of a webpage. The tooling to get a report with details from the time it takes to establish a server connection to the time it takes for the full page to render is out there. In fact, there’s great tooling right under the hood of most browsers in DevTools that can do many things that a tried-and-true service like WebPageTest offers, complete with recommendations for improving specific metrics.
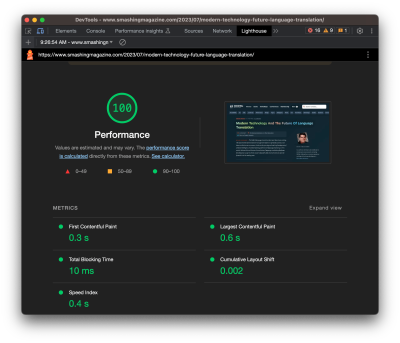
I don’t know about you, but it often feels like I’m missing something when measuring page speed performance. Even with all of the available tools at my disposal, I still find myself reaching for several of them. Certain tools are designed for certain metrics with certain assumptions that produce certain results. So, what I have is a hodgepodge of reports that needs to be collected, combined, and crunched before I have clear picture of what’s going on.
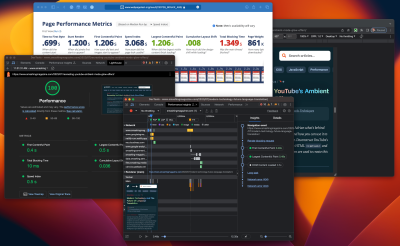
The folks at DebugBear understand this situation all too well, and they were kind enough to give me an account to poke around their site speed and core web vitals reporting features. I’ve had time to work with DebugBear and thought I’d give you a peek at it with some notes on my experience using it to monitor performance. If you’re like me, it’s hard to invest in a tool — particularly a paid one — before seeing how it actually works and fits into my work.
Monitoring vs. Measuring #
Before we actually log in and look at reports, I think it’s worth getting a little semantic. The key word here is “monitoring” performance. After using DebugBear, I began realizing that what I’ve been doing all along is “measuring” performance. And the difference between “monitoring” and “measuring” is big.
When I’m measuring performance, I’m only getting a snapshot at a particular time and place. There’s no context about page speed performance before or after that snapshot because it stands alone. Think of it like a single datapoint on a line chart — there are no surrounding points to compare my results to which keeps me asking, Is this a good result or a bad result? That’s the “thing” I’ve been missing in my performance efforts.
There are ways around that, of course. I could capture that data and feed it into a spreadsheet so that I have a record of performance results over time that can be used to spot where performance is improving and, conversely, where it is failing. That seems like a lot of work, even if it adds value. The other issue is that the data I’m getting back is based on lab simulations where I can add throttling, determine the device that’s used, and the network connection, among other simulated conditions.
On that note, it’s worth calling out that there are multiple flavors of network throttling. One is powered by Lighthouse, which observes data by testing on a fast connection and estimates the amount of time it takes to load on different connections. This is the type of network throttling you will find in PageSpeed Insights, and it is the default method in Lighthouse. DebugBear explains this nicely in its blog:
Simulated throttling provides low variability and makes test quick and cheap to run. However, it can also lead to inaccuracies as Lighthouse doesn't fully replicate all browser features and network behaviors.
In contrast, tools like DebugBear and WebPageTest use more realistic throttling that accurately reflects network round trips on a higher-latency connection.
Real usage data would be better, of course. And we can get that with real-user monitoring (RUM) where a snippet of code on my site collects real data based on from real network conditions coming from real users is sent to a server and parsed for reporting.
That’s where a tool like DebugBear makes a lot of sense. It measures performance on an automated schedule (no more manual runs, but you can still do that with their free tool) and monitors the results by keeping an eye on the historical results (no more isolated data points). And in both cases, I know I’m working with high-quality, realistic data.
From there, DebugBear notifies me when it spots an outlier in the results so I am always in the know.
The DebugBear Dashboard #
This is probably what you want to see first, right? All I had to do to set up performance monitoring for a page is provide DebugBear with a URL and data flowed in immediately with subsequent automated tests running on a four-hour basis, which is configurable.
Once that was in place, DebugBear produced a dashboard of results. And kept doing that over time.
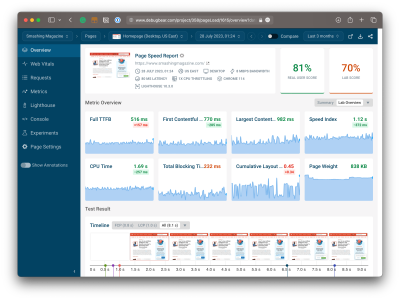
You can probably look at that screenshot and see the immediate value of this high-level view of page performance. You get big score numbers, mini charts for a variety of web vital metrics, and a filmstrip of the page rendering with annotations identifying where those metrics sit in the process, among other great pieces of information.
But I’d like to call out a few especially nice affordances that have made my performance efforts easier and, more importantly, more insightful.
Working With Page Speed Data #
I’ve learned along the way that there are actually multiple kinds of data used to inform testing assumptions.
One type is called lab data. It, in turn, has its own subset of data types. One is observed data where CPU and network throttling conditions are applied to the test environment before opening the page — “applied throttling” as it were. Another is simulated data which describes the Lighthouse method mentioned earlier where tests are done on a high-powered CPU with a highspeed network connection and then estimates how “fast” a page would load on lower-powered devices. Observed data is the high-quality type of lab data used by tools like DebugBear and WebPageTest. Simulated data, on the other hand, might be convenient and fast, but also can be innacurate.
A second type of data is called real-user data. This is high-quality data from actual website visitors, for example based on Google’s Chrome User Experience (CrUX) Report. The report, released in 2017, provides network data from sessions collected from real Chrome users. This is high-quality data, for sure, but it comes with its own set of limitations. For example, the data is limited to Chrome users who are logged into their Google account, so it’s not completely representative of all users. Plus, the data is aggregated over 28 days, which means it may not be not the freshest data.
Alongside the CrUX report, we also have the RUM approach to data that we discussed earlier. It’s another type of real-user monitoring takes real traffic from your site and sends the information over for extremely accurate results.
So, having both a “real user” score and a “lab” score in DebugBear is sort of like having my cake and eating it.

This way, I can establish a “baseline” set of conditions for DebugBear to use in my automated reports and view them alongside actual user data while keeping a historical record of the results.
Comparing Tests #
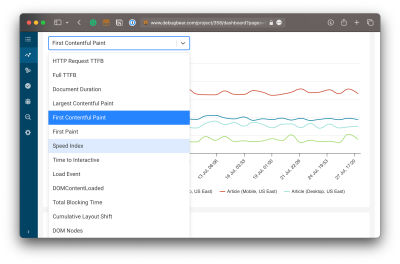
Notice how I can dig into the data by opening up any test at a specific point in time and compare it to other tests at different points in time.
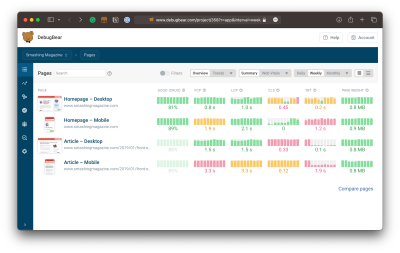
The fact that I can add any experiment on any page — and as many of them as I need — is just plain awesome. It’s especially great for our team here at Smashing Magazine because different articles use different assets that affect performance, and the ability to compare the same article at different points in time or compare it to other pages is incredibly helpful to see exactly what is weighing down a specific page.
DebugBear’s comparison feature goes beyond mini charts by providing larger charts that evaluate more things than I can possibly print for you here.
Running Page Test Experiments #
Sometimes I have an idea to optimize page speed but find I need to deploy the changes to production first so that a reporting tool can re-evaluate the page for me to compare the results. It would be a lot cooler to know whether those changes are effective before hitting production.
That’s what you can do with DebugBear’s Experiments feature — tweak the code of the page being measured and run a test you can compare to other live results.
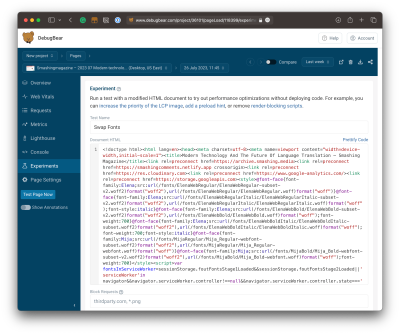
This is the kind of thing I would definitely expect from a paid service. It really differentiates DebugBear from something like a standard Lighthouse report, giving me more control as well as tools to help me gain deeper insights into my work.
Everything In One Place #
Having all of my reports in a central one-stop shop is worth the price of admission alone. I can’t stand the clutter of having multiple windows open to get the information I need. With DebugBear, I have everything that a mish-mash of DevTools, WebPageTest, and other tools provides, but in one interface that is as clean as it gets. There’s no hunting around trying to remember which window has my TTFB score for one experiment or which has the filmstrip of another experiment I need.
But what you might not expect is a set of actionable recommendations to improve page speed performance right within reach.
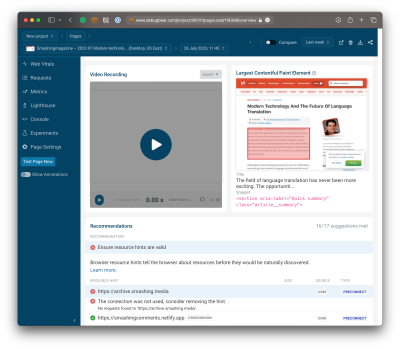
Let me be clear that I am no performance expert. There are plenty of situations where I don’t know what I don’t know, and performance is one of them. Performance can easily be a profession and full-time job by itself, just as design, accessibility, and other specializations. So, having a list of things I can do to improve performance is incredibly helpful for me. It’s like having a performance consultant in the room giving me directions.
Wrapping Up #
Again, this is merely a peek at some of the things that DebugBear can do and what I enjoy about it. The fact is that it does so many things that I’ve either glossed over or simply lack the space to show you.
The best thing you can do is create a free DebugBear account and play around with it yourself. Seriously, there’s no credit card required. You set up a username and password, then it’s off to the races.
And when (not if!) you get your account, I’d love to know what stands out to you. Performance means a lot of things to different people and we all have our ways of approaching it. I’m keen to know how you would use a suite of features like this in your own work.
No comments:
Post a Comment